What if I told you…
You could spend less money, while also making MORE money?
Seem impossible?
I remember the year I gave our CEO the annual marketing report,
along with last year’s for comparison.
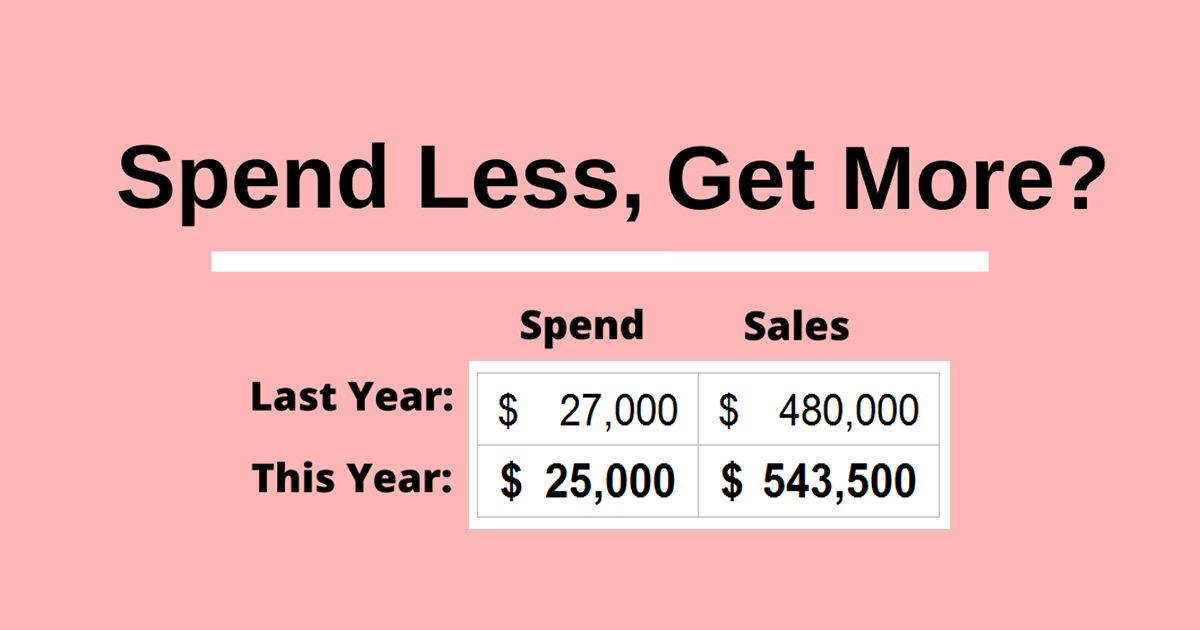
He held them side by side, and noticed exactly that –
we had spent less marketing dollars than the year before,
and yet our sales revenue had also increased from the year before
(yet again surpassing the company’s goal).
Wondering how to improve your return on investment (ROI) while spending less?
Your return on investment can be increased by following these steps, explained in detail below:
Read to end of this article for a free copy of a simple to use COS-tracking spreadsheet!
(And if all this sounds like a good idea but too much work,
feel free to contact me to do it for you!)
1: Track your sales process in a CRM system
If you aren’t using one already, a CRM is a must-have for any company or entrepreneur
wanting to scale their business to the next level. You may think you “have it all handled”,
but trust me – the advantages of a CRM far outweigh the costs
(there are plenty of free options, like Hubspot).
A CRM adds a level of trackability that every business needs to ensure a consistent client experience.
Aside from that, CRMs can be great tools to track your marketing efforts.
You can assign your leads/sales to a marketing source,
and then create reports to analyze where your leads/sales are coming from.
You may have a rough idea the breakdown already,
but a computer tracking these numbers specifically over time
will allow you to observe the data in a different way.
Having a top-down, birds eye view of your data will allow you
to see patterns and trends that will eventually save you money.
The benefits of a CRM can’t be stated enough.
2: Summarize the data into reports
Once you have enough data to go from, you can begin to analyze trends.
When you track the sales process from lead to closed won/lost sale,
the information you can learn becomes invaluable.
If you track the marketing source with the lead/sale in your CRM,
you will be able to create a monthly Lead Source Report.
Many CRMs have automated reports,
but you can also download the data & summarize it yourself in excel
(pivot tables are your best friend!).
Print a monthly, quarterly, and yearly Lead Source Report
where you rank your lead source based NOT on the number of leads,
but on the sales revenue it generated.
This is an important distinction:
a quality lead source isn’t one that gets you a high amount of LEADS,
it’s one that gets you a high amount of REVENUE.
The amount of leads don’t matter as much as how much money they converted to.
For instance – at one company, I created weekly Lead Source Reports.
Keeping these numbers and the source’s rankings fresh helped us to keep our
finger on the pulse of where our focus needed to be.
Then, every month we had a meeting where I ranked our highest to lowest performing lead sources
on not just their sales revenue, but the Cost of Sale (COS).
We analyzed the paid sources first, then free sources.
Following this process and analyzing how to improve the COS of our bottom sources
while maximizing our investments in the top sources
caused their number of leads to climb while their cost per lead continued to drop.
3: Analyze the Cost of Sale (COS)
What is Cost of Sale, and how is it different from Return on Investment?
ROI is calculated by dividing what you gained by what you spent.
For "gain" you could use the sales revenue or the exact profit, if it's known.
For these examples, we'll keep it simple and look at sales revenue:
If you spend $120 to get a lead that turns into a $1500 sale, your ROI is
$1500 / $120 = 12500%.
The COS of that sale is the exact opposite – divide spend by sales revenue. (So, $120 spent / $1500 sold = 8% COS)
If you want to increase your ROI, you must decrease your cost of sale.
Why does this matter?
You could track ROI instead of COS,
but we found that working to drive the COS down below a certain % meter stick was much easier to track.
Improving performance by trying to infinitely increase large numbers is not as easy to digest as setting a “bar” for max cost of sale,
seeing which sources fall above/below that cut line, and reinvesting accordingly.
Find your overall COS:
1. Choose a time period ideally long enough to show real trend; 3 months to 1 year
2. Divide total spent / sales revenue for instance - $27K spent / $480K sold = 5.6% COS
If you are new to creating a marketing budget, this part is key.
With COS, you start by identifying your marketing budget. Let’s say it’s 6% of your sales goal.
So if you plan to sell $500K, your marketing budget is $30K (6%).
This means for every $100 spent, the company expects to earn roughly $1670 back.
If company's "actual" spend was $27K / $480K = 5.6% COS...
In this example, the goal was 6% and the actual result was 5.6%. Meaning, every $100 spent = $1785 return.
5.6% instead of 6% is GOOD – it means the “cost per sale” is lower than planned.
With ROI you want to increase the number as high as possible,
with COS you want to decrease the number as low as possible.
Notice a few things…
At a 5.6% COS, if the company had spent the full 30K budgeted they would have been projected to earn $535K - well above their goal.
Alternatively, if they can improve their COS to 5.4%, they'll reach their $500K goal on the exact same spend ($27,000 budget / 5.4% COS = $500K)
If they can improve their COS to 5%, they will surpass their goal on the exact same spend ($27,000 budget / 5% COS = $540K)
Before we get into how to spend less, let's look at the first option first - wisely investing the additional $3K.
If you find you’re spending is on budget and goals are on track,
you may think there’s no reason to create a more detailed report.
On target, on budget, no problems – right?
You are possibly missing a money-sucking problem.
4: Break down reports to find anomalies
Instead of just calculating the overall results against the company goals,
to improve your marketing ROI while also lowering spend, it’s important to analyze the performance of each individual source.
The Cost of Sale (COS) Report provides a snapshot view of how each source performs against your company benchmark.
For instance, let’s take the same “Sample Company” as above:
Company goal: $500K on a $30K spend (6% COS = budget)
Actual results: $480K on a $27K spend (5.6% COS = company benchmark)
When you break down the sales data in your CRM by lead source,
you start to see which sources perform over the benchmark and which are under performing.
For example, this “Sample Company” found they had the following breakdown…
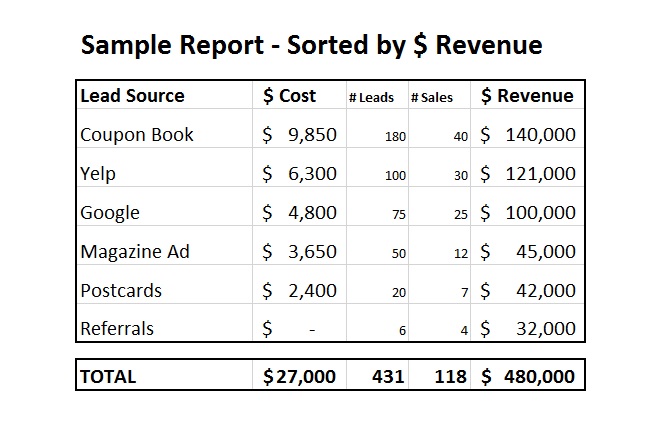
If you view the data sorted by $ Revenue, It looks like everything is in order. The highest spend sources result in the highest revenue.
If you were in charge of spending the extra $3K, which source would you invest it in?
The tempting answer could be Coupon Book. It has the highest spend but also the highest return, the most leads and sales. Seems like a great choice, right?
Another answer could seem to be Postcard or Magazine Ad. These spends are low; could more spend = more results?
Before deciding, look at the report again - this time sorted by Cost of Sale:
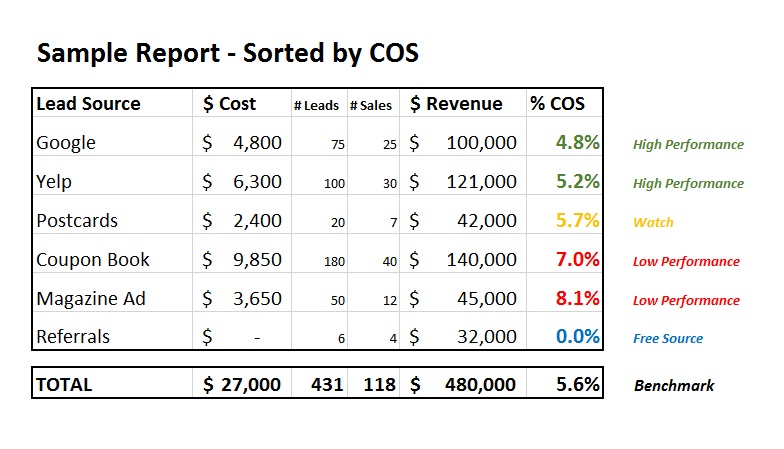
Notice what happens – COS gives a fair, apples:apples comparison on the performance of your lead sources.
In this view, a few observations are key:
The highest $ revenue (Coupon Book) is NOT the best performing source.
Both Google & Yelp have a COS below the company benchmark. These are the BEST choices to consider additional investment.
Coupon Book & Magazine Ad are more expensive than the 6% budget. The over-performance of the top sources was masking the under-performance of these sources.
5: Adjust investments depending on findings
With this list sorted by COS, is it more clear where your additional $3K will go the farthest?
If your original answer was Coupon Book...
Based on a 7% COS, 3K would result in $42K additional revenue.
If your new answer is Google...
Based on a 5% COS, 3K would result in $60K additional revenue – 30% more, from the exact same spend.
If instead you noticed that the company is low on referral sales and doesn't have an existing incentive ($0 spent) and asked “what about investing the $3K into launching a referral rewards program?” – you are starting to get it.
The Law of Diminishing Returns
One thing to bear in mind is the law of diminishing returns.
Meaning, some people might be tempted to look at the above and say
“Wow! If Google has the best Cost of Sale,
I should just invest the whole $30K into Google next year and get the best ROI.”
While that MAY be true, realize the more you invest in a single source –
the less you may receive. If you’re only capturing 3% of the market on Google,
jumping from 5 to 30K invested may work.
But if you’re already close to tapping a market out,
adding more money will just raise the cost without giving that same great return.
Operating a marketing budget is a lot like an investment portfolio;
it’s a balancing act of investing into different types of sources,
monitoring and adjusting spend until you find the perfect “sweet spot”.
6: Track & compare results, adjust accordingly
By making these observations through regular monthly reports, you will begin to notice trends.
-
Is there seasonality to any of these sources? Should you adjust spend depending on the month, or are your results consistent no matter what time of year it is?
-
Which are your low performers, and how can you improve their COS?
- Which are your top performers, and how can you wisely invest more into them?
For example: if a magazine ad has a high COS…
Does the ad need to be refreshed? How’s your offer, compared to the competition? Have you looked at your competitor’s ads lately?
A personal example:
At one company, we found our results in a certain magazine to be lower than usual. We tweaked the ad for months, nothing seemed to work… until we picked up the magazine and flipped to our competition. We then noticed we were the ONLY company in our industry still offering 15% off – everyone else’s call to action had risen to 20%-30% off.
Instead of raising our discount to match our competitors, we shifted our offer to something else completely. This helped us avoid being in the “price war” game, but remain competitive by comparison.
The improved call volume and COS spoke for itself.
Can you create a report by zip code, and see which territories are performing well/poorly?
Before dropping a badly performing source altogether, analyze it further. You might find after breaking down the report by county/zip code, a few areas may perform great while others are sucking up the budget for little result.
I did this analysis constantly – even for well performing sources.
In one instance, of the $150K we invested into a marketing source that performed well I found $16K of that went to a territory that had ONE $20K sale (80% COS in that region for the entire year).
With our COS “cut line” being 10% or lower, it was a big loss. Who would spend $16K to make $20K? Nobody, but these kinds of results are easily missed when you generalize and look only at results as a whole.
How did that get missed? Well, there were a few territories that performed AMAZING – 1-3% COS. When you looked at the source as a whole, the results averaged out to 6-8%.
We cut the low performing territories, maximized the higher performing territories, and watched a “good” COS become “great”. This not only improved our ROI, it lowered our cost per lead.
Over time, if you take this approach you will notice your money begin to go further. Marketing is an art, not a science. But, the more you can quantify your results, the clearer it becomes where to focus your time and money.
Improving ROI while Decreasing Spend
But - how can you increase return on investment WITHOUT investing any more?
How can you increase sales revenue while decreasing marketing spend?
Let’s look again at how “Sample Company” performed:
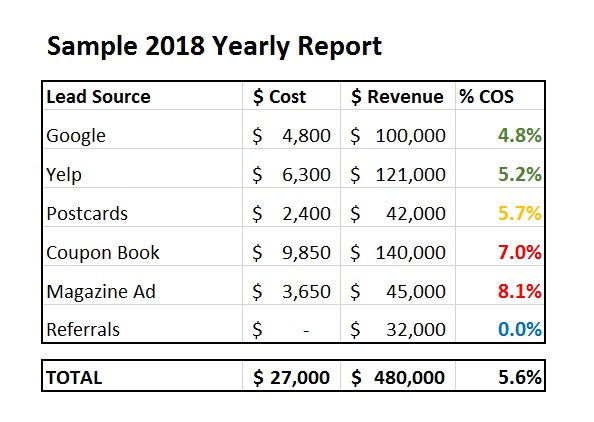
Based on the above breakdown, let’s say the company decides to:
Analyze Coupon Book by territory, cut spend in all low performing zip codes.
Analyze Magazine Ad by month, discover the ad performs best in Summer. Drop mag ad for rest of year.
Invest as much of the savings into the highest performing sources as possible, without raising their COS above the company benchmark.
Run an A/B test of different postcard designs, then change all areas to the better performing ad.
Create a Referral Rewards program, offering a $ incentive for referring a friend.
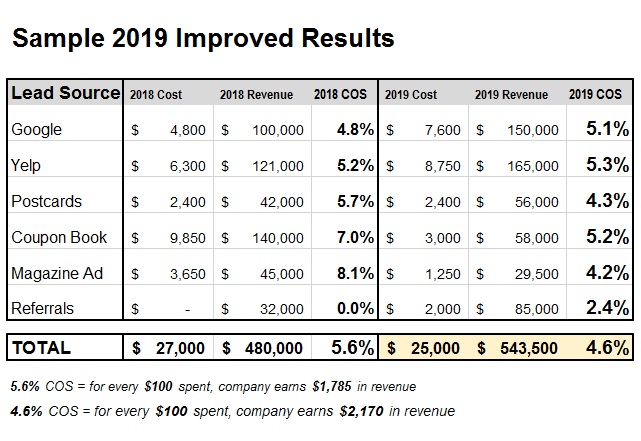
Notice the key differences:
Spend has decreased from $27K to $25K ($2K saved)
Results have increased from $480K to $543K ($63K additional earned)
This was achieved by improving COS just one point, 5.6% to 4.6%
This is an example of exactly what could happen for you,
if you track COS and use it as a tool for comparison.
At my previous company,
this method resulted in our COS eventually becoming roughly half of what it was when I first began...
Meaning, over time, our marketing dollars literally began to stretch twice as far.
Free Small Business Resources
If you’d like an excel file pre-programmed with calculations for:
Cost of Sale, Cost Per Lead, Revenue Per Lead, Closing Ratio, Average Order, etc...
Get a free copy here!
If this is all making your head spin and you want someone to do it for you –
reach out to me.
I can create these reports for you, and give you at-a-glance snapshots.
Sarah Rose
About the Author
Sarah has 10+ years of experience helping businesses & entrepeneurs flourish! After years of success as a Program Director & Marketing Manager, she established "Rose Consulting Services". Her focus is a results based, action oriented approach to solve pain points and help her clients achieve their business & personal goals. Sarah has developed a unique skillset to assist anyone looking to improve work efficiency, build confidence in the workplace, or maximize ROI on business initiatives.
Contact Sarah »Learn More »